


Your energy over time as a graph: your life phases, peaks and dips, and the signals behind them.
What it does
See your life as a line rather than a single day, built from your dates and anything you log.
Phase dates come from your birth chart. Scores for a phase wait until you have logged something from it, so the graph does not guess.
What it computes
- Your energy over time
- Your life in phases
- Peaks and dips
What you will get and see
These are real screens from the app, shown with a sample profile. Your reading is built from your own birth details, so your values will differ. Tap an image to see it larger.
1 / 4
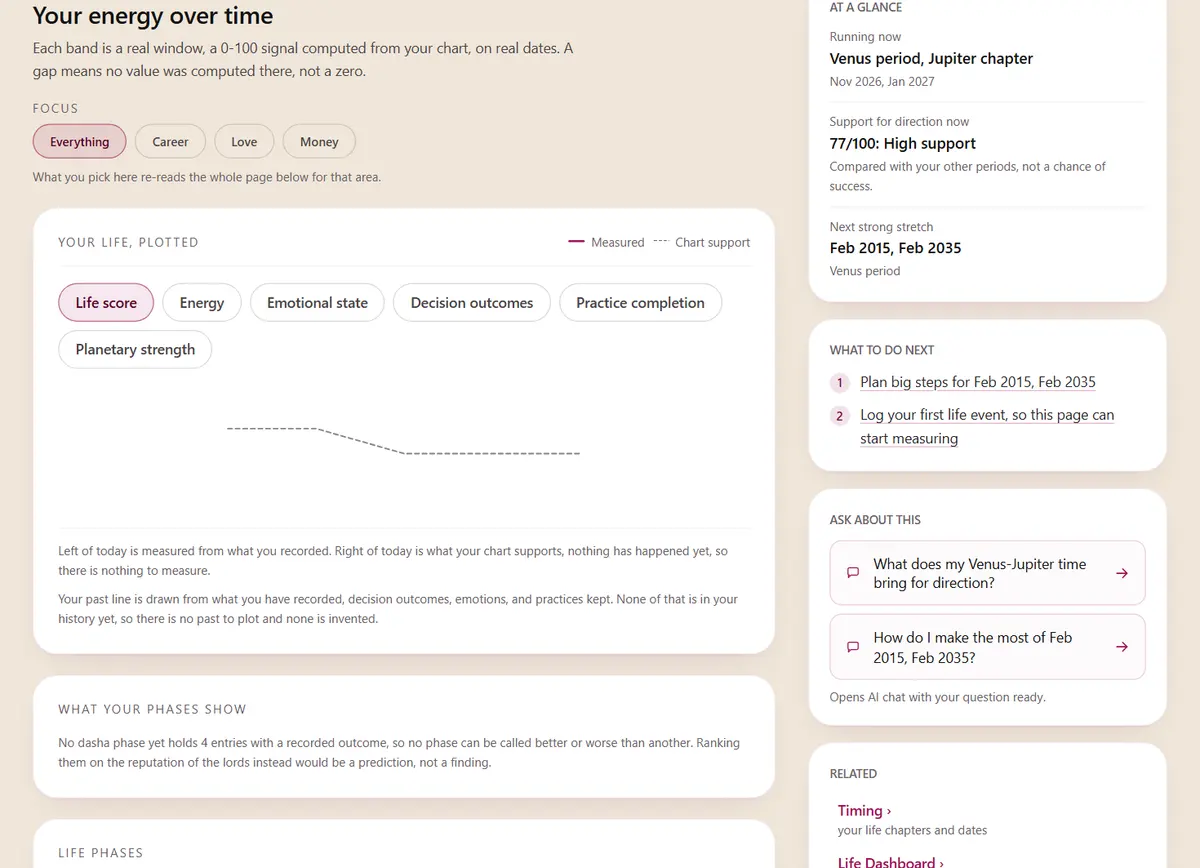
Your energy over time
A graph you can switch between life areas, with the current phase beside it.
2 / 4
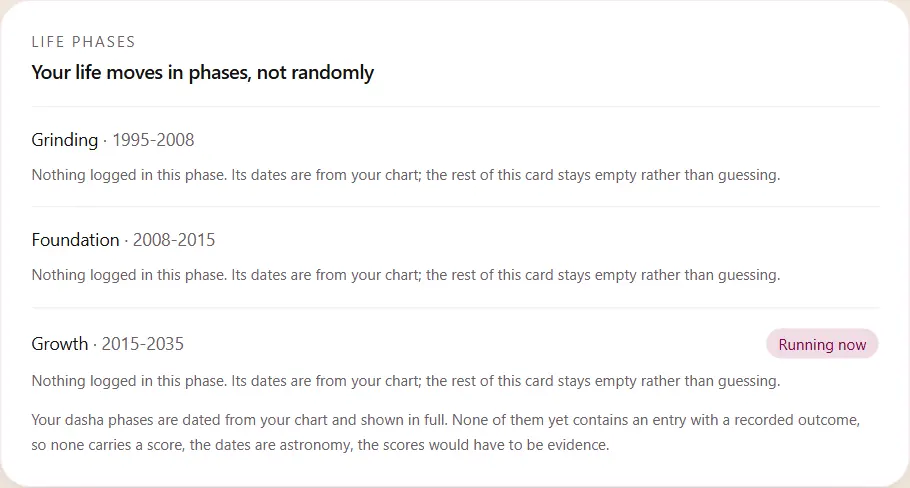
Your life in phases
Each past and current phase with its dates. It waits for what you log before scoring any phase.
3 / 4
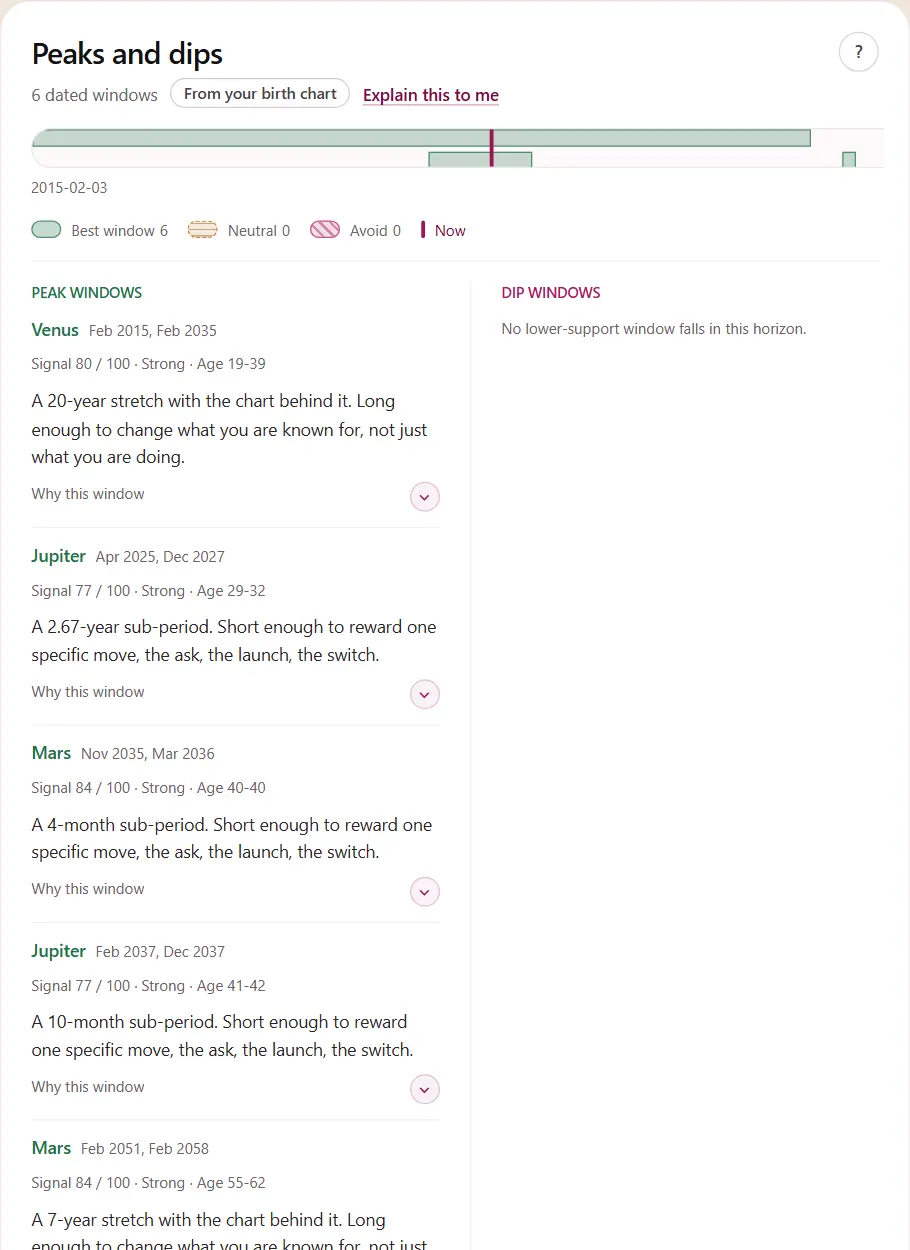
Peaks and dips
The strongest and weakest windows, each with dates and what to do with it.
4 / 4
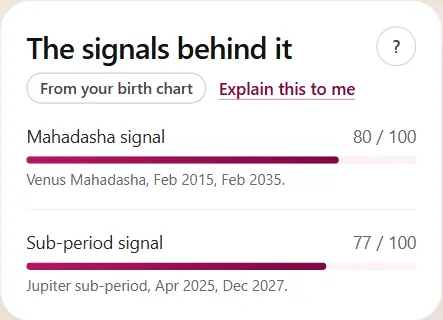
The signals behind it
The scores that feed the graph, so you can see what is pushing it up or down.
What it needs
Your birth date, time and place, entered once when you sign up.
What it does not know
It cannot tell you what will happen. It shows what your chart and numbers read as guidance, and it is not medical or financial advice.
Common questions
- What do the peaks and dips mean?
- They are the strongest and weakest windows computed for you, each with dates and what to do in it. They are conditions, not events that must happen.
- Can I see one life area?
- Yes. The graph can be switched between areas such as career, love and health.
Where this lives in the app
With an account, this opens at /life-graph. This page only describes it; the actual calculation runs there, on your own details.
Related to this
Run this on your own birth details
The free calculators run without an account. With one, this same chart connects to every feature here and stays saved.
Every feature is open on every account until payments are switched on, and no card number ever reaches our server.
No birth details are collected on these pages - they are for reading only.